In projection technology, accurate and repeatable brightness measurements form the foundation for validating performance in settings from corporate boardrooms to expansive educational halls. Specialists in technical roles, engineers handling procurement, and teams focused on quality assurance rely on solid methods to confirm manufacturer claims, and grasping how to measure ANSI lumens for projectors using the 9-point test delivers a standardized approach that yields dependable, comparable outcomes. This method, first outlined in ANSI IT7.228-1997 and later aligned with ISO 21118:2020, determines brightness through an average of illuminance readings from nine specific points on a full-white projected image, addressing natural variations in light distribution. Adopting this technique allows firms to spot gaps between stated and real performance, supporting informed choices in selecting products and integrating systems.
Answer: How to Measure ANSI Lumens for Projectors Using the 9-Point Test
Conducting measurements of ANSI lumens calls for strict management of surroundings, equipment, and steps to cut down on consistent errors and boost consistency. The setup requires ambient light under 1 lux—essentially pitch black—and a steady room temperature of 25 ± 2°C, following ANSI guidelines, to avoid heat impacting the light source efficiency. Place the projector at a standard 2.4-meter distance from a screen with 1.0 gain for diffuse reflection, creating a 60-inch diagonal image over about 1.08 square meters. Any changes from this baseline demand adjusted area calculations to maintain accuracy.
Key tools involve a calibrated meter for illuminance with a sensor corrected for cosine effects to handle angled light, a reliable generator for test patterns producing a full-white field at the unit’s native resolution and depth, and a matte screen free of reflections to prevent glare spots. Before starting, let the source—be it UHP lamp, RGB laser, or LED-phosphor setup—settle for at least 30 minutes, where output often levels off after an early increase of 5–12% based on the type. Turn off features like eco settings, auto iris, and contrast boosts, since they cause fluctuations that clash with the steady ANSI process.
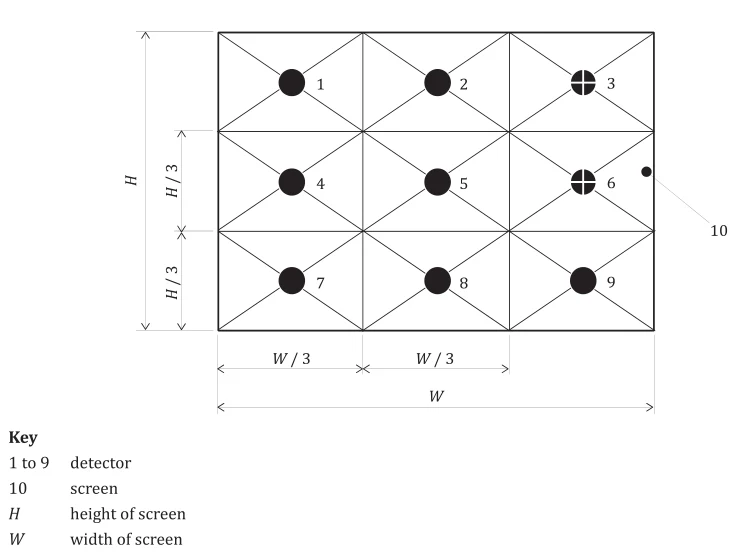
Apply a exact 3×3 grid over the image, marking points at the center, midpoints on all four edges (50% along horizontal or vertical), and corners (shifted 10% inward to sidestep heavy edge drop-off). Set the lux sensor 10 cm off the screen, straight on, and note values point by point to limit any sensor shift. In standard DLP setups with Texas Instruments DMD components, center light often tops corners by 20–35% from lens effects, light path uniformity, and mirror angles.
Find the simple average of those nine illuminance figures for mean lux. Translate to ANSI lumens with: ANSI lumens = average lux × screen area (m²). In the 60-inch reference, this matches directly with the 1.08 m² area. Run at least three separate rounds, dropping any with over 3% change inside as a sign of unrest. Average valid results, noting both the ANSI lumens mean and deviation for repeatability—top systems show variation coefficients under 2%.
Further steps include checking signal quality (full white at 8-bit or more without artifacts), verifying color temp close to D65 (6500 K), and recording firmware details, as changes can shift LED drives or laser patterns. For single-chip DLP with color wheels, time readings to dodge wheel spin interference, usually 120–240 Hz.
Principles of Optics in DLP Brightness
In DLP projectors, brightness stems from conserving étendue and recycling light effectively along the path. The DMD uses millions of tilting aluminum mirrors at ±12° or ±17° per model, sending light to the lens or away. Flux efficiency hinges on aligning source étendue with DMD size; bigger chips like 0.65-inch or 0.47-inch TRP handle more flux up to 1600 ANSI lumens before losses build, while smaller 0.23-inch or 0.33-inch cap at 600–1000 ANSI from size limits.
Integrators like light tunnels even out arc or LED light before hitting the DMD, cutting uneven spots that affect 9-point spreads. Laser-phosphor types convert blue lasers to white on phosphor wheels at efficiencies near 300 lm/W, far above UHP lamps at 50–80 lm/W. Yet heat can quench phosphor, stressing the need for controlled test temps.
Telecentric designs in current DLP engines keep ray angles steady across the DMD, lifting corner uniformity to 80–90%. Off-center rays face lower fill and more lens cut-off, leading to brighter centers as seen in 9-point grids. Color wheels or quick lasers for sequential colors add time blending; faster spins (4×–6×) cut color artifacts but trim white flux slightly from filters and polarization.
Importance of the 9-Point Test in Projector Brightness Accuracy
Center-only readings often inflate brightness by 30–50% in basic optics, overlooking falloff and lens flaws. The ANSI 9-point average includes these distributions on purpose, linking to viewed quality over the whole image. Ratios under 70% (min to center) create gradients that hurt clarity in data displays or simulations.
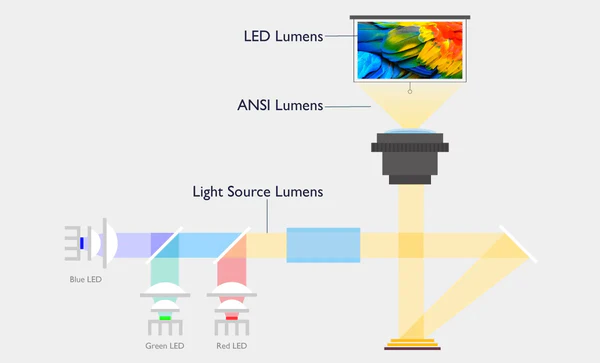
Reviews of industry specs show non-ANSI terms like LED lumens boost claims 2–3×, causing real-world gaps. The 9-point standard tests delivered light under set conditions, allowing fair maker comparisons vital for business buys.
For DLP, it spotlights strengths: high duty cycles near 90% in white, plus contrast over 2000:1, keeping brightness feel strong at moderate ANSI. Triple-laser skips wheel wear for lasting stability.
Influences on Measurements: Size, Ambient Light, and Beyond
Image area grows opposite to illuminance for set flux: from 60 to 100 inches, area jumps ~2.78×, dropping lux and ANSI unless distance shifts. Hold f-number and focus steady when changing to separate size impacts.
Ambient adds blanket light, raising blacks and cutting contrast. At 100 lux in lit offices, contrast might drop below 10:1 despite base specs. Standard tests demand <1 lux, subtracting any leftovers point-wise if needed.
Gains over 1.0 boost center lux but sharpen angle drop, lowering corners and possibly ANSI by 10–20%. Temps above 25°C cause LED drop (~0.8%/°C) or laser phosphor fade. Voltage swings >±3% alter LED currents, varying output.
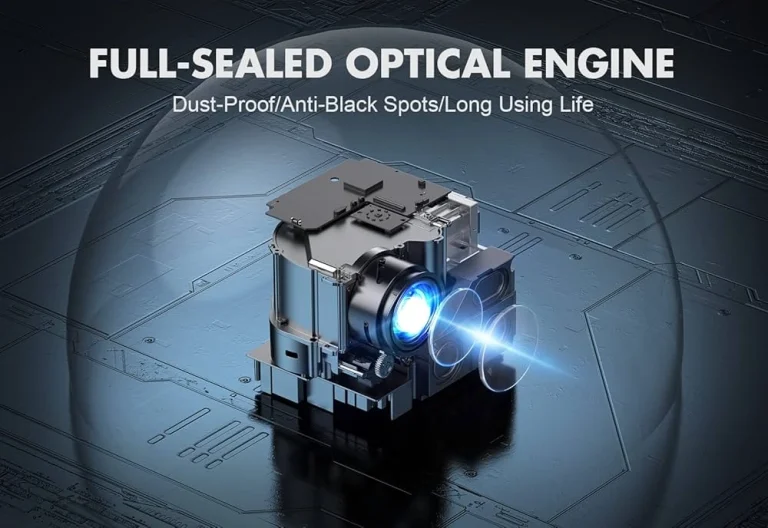
Dust on lenses or tunnels scatters 5–15% light. Firmware dimming for heat cuts output in long white tests.
Deeper Uniformity in 9-Point Setup
Figure center-corner uniformity as (avg corner lux / center) × 100%, aiming ≥80% for high-end lenses. Grid-wide uses (min / max) × 100%, with DLP hitting 75–92% via tuned integrators and relays.
Add deviation normalized to mean (CV%), under 5% for top evenness. Mapping hotspots shows lens issues or DMD misaligns; over 15% from Gaussian suggests recalibration.
Batch stats across units gauge make consistency—CV% <3% means tight control in phosphor and bonding.
Errors and Validation Stats
Fixed errors come from meter cosine (>3% past ±60°), spectral mismatches to V(λ), and polarization in meters vs DLP light. Random from source flickers (UHP arcs) and shakes.
Counter with three repeats and ANOVA for variance breakdown. Z-score outliers (>3.5) mark bad runs. 95% intervals usually ±2–4% in solid tests on stable gear.
B2B Specs and Criteria to Avoid Issues
Strong specs require ANSI IT7.228 or ISO 21118 testing, with raw 9-point tables, ANSI calc, uniformity, and env logs. Set pass at claimed ±5%, with outside checks for big lots.
Cover prototype vs production: full on prototypes, 5% AQL on runs. Note 1.0 gain screen, 25°C, no dynamics in tests.
Sample clause: “Supplier must supply ANSI lumens cert showing avg illuminance over nine points at [X] lumens ±5% on 60-inch 1.0 gain at 2.4 m, 25°C, <1 lux. Include raw data and grid photos.”
Non-match remedies: credit for fixes, swaps, or 15% order penalty to push internal checks.
Typical Errors and Fixes in ANSI Testing
Starting pre-stabilization undercuts by 8–15%. Grid offsets add up to 10% sampling error; use overlays or lasers for accuracy.
Wrong patterns or res mismatches lower flux. Lingering ambient needs sealing and baseline cuts.
Meter shifts mid-run call for recal against refs.
Tools and Resources Suggested for Testing
NIST-calibrated Class A lux meters with logs add stats strength. Software like Zemax or LightTools predicts uniformity from designs.
Check Toumei’s DLP projectors with verified 600–1600 ANSI performance. For tailored flux validation, see OEM/ODM services. Dive into DMD expertise on About Us, or browse Toumei homepage for products.
DLP Brightness Tech Notes
Scaling follows étendue caps: big DMDs (0.65-inch TRP) push >3000 ANSI via wider angles. Lasers gain efficiency with narrow primaries, cutting filter hits vs LEDs.
Features like MEMS focus and correction hold stability in long tests. Short-throw (0.8:1) packs flux for brighter screens close up.
About Shenzhen Toumei Technology Co., Ltd.
Established 2013 in Shenzhen, China, Shenzhen Toumei Technology Co., Ltd. operates as a high-tech firm centered on DLP smart projections. Using Texas Instruments DLP® tech, it covers R&D, production, and sales of smart projectors and 3D systems. With over 50 patents, Toumei offers full OEM/ODM from optics to hardware/software, design, and QA. Teams push laser autofocus, 1080p/4K, compact builds. Facilities output >20,000 units monthly, backed by quality certs. Emphasizing innovation, reliability, customization, Toumei partners globally for visual solutions meeting varied needs.
Conclusion
Mastery of the 9-point ANSI lumens method arms tech and buying pros with a proven standard to check brightness claims, curb spec risks, and confirm systems fit needs. Via optics principles and stats checks, firms gain solid metrics leading to better visuals.